
Top U.S. Jobs That Could Use a Massage
Stress. U.S. workers are no stranger to it — from mental to physical strain, across various professions. In fact, 66% of American employees are experiencing burnout¹ in 2025, and 54% say job insecurity² is causing serious stress levels at work.
Though massage therapy isn’t a magical solution to eliminate stress, Beauty & Bodywork Insurance (BBI) knows it can be an effective tool in promoting relaxation and supporting overall wellness.
So, what are the most stressful jobs? To create this annual report on the top professions that can benefit from massage therapy, we narrowed down over 900 jobs to a more focused group of 250. We eliminated jobs with fewer than 50,000 employed and those including “miscellaneous” in their titles.
Next, we evaluated each of the remaining jobs against 10 key metrics, divided into two categories: physical strain and mental strain. Some job titles have been shortened slightly to fit the table below. Check out the full methodology at the foot of this page!
Working pros, see where your job ranks. Massage therapists, meet your clients. Scroll to see who’s stressed in the U.S.!

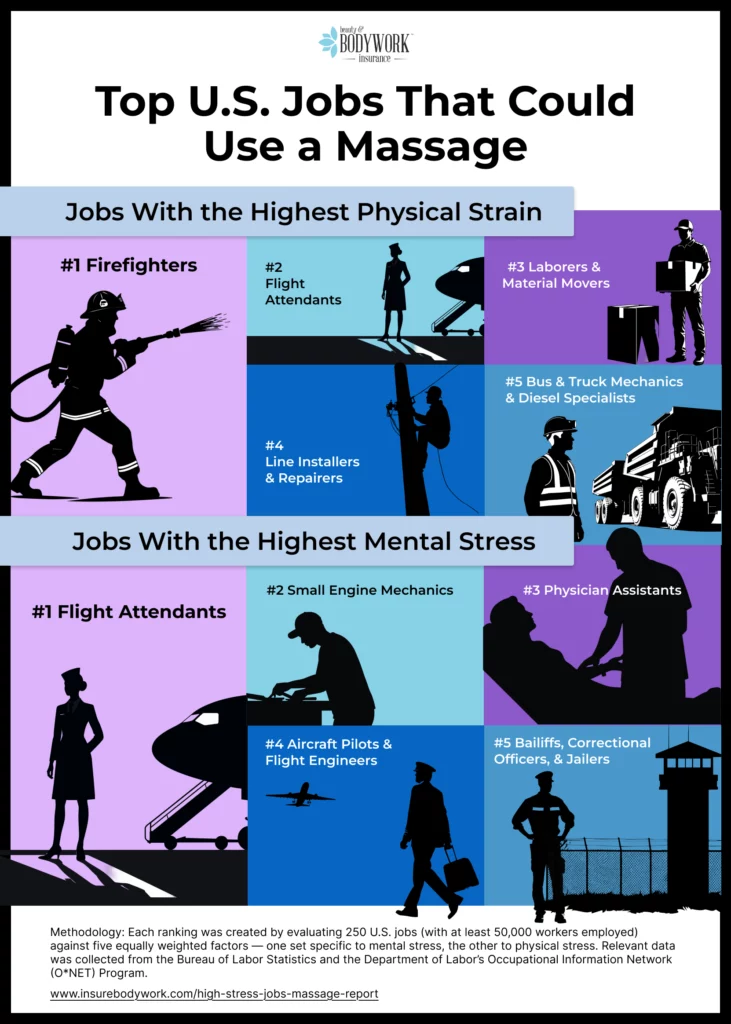
Table of Contents
Key Findings
Rankings Table: Most Physically Stressful Jobs
Overview of the Top 5 Most Physically Stressful Jobs
- Firefighters
- Flight Attendants
- Laborers & Material Movers
- Line Installers & Repairers
- Bus & Truck Mechanics & Diesel Specialists
Rankings Table: Most Mentally Stressful Jobs
Overview of the Top 5 Mentally Stressful Jobs
- Flight Attendants
- Small Engine Mechanics
- Physician Assistants
- Aircraft Pilots & Flight Engineers
- Bailiffs, Correctional Officers, & Jailers
Insights From Massage Therapists
The Most Stressful Jobs Ranked by Physical Strain
Here are the most physically demanding jobs, ranked from most stressful at number 1 to least stressful at number 250.
This table defaults to equal weighting for each physical stress factor, providing a neutral baseline. Adjust the sliders to customize the ranking based on what’s most important to you.
Each category was intentionally selected for its relevance to physical stress and consistent data availability across all included professions.
Desktop: Adjust each metric slider to change how much it weighs in the overall ranking.
Mobile: Click “show controls” to display sliders and adjust each metric.
| Overall Rank | Job Title | Exertion Injuries per 10k | Standing Score | Strength Score | Stamina Score | Cramped Work Score |
|---|---|---|---|---|---|---|
| 0 | Firefighters | 108.6 | 61 | 4.62 | 60.5 | 66 |
| 0 | Flight Attendants | 228.5 | 77 | 2.93 | 40.5 | 80 |
| 0 | Laborers and Material Movers | 210.1 | 76 | 3.38 | 49 | 60 |
| 0 | Line Installers and Repairers | 142.5 | 80 | 3.43 | 49 | 66 |
| 0 | Bus and Truck Mechanics and Diesel Specialists | 68.3 | 85 | 3.55 | 41.5 | 84 |
| 0 | Nursing Assistants and Psychiatric Aides | 285.2 | 85 | 3.04 | 43 | 39 |
| 0 | Structural Iron and Steel Workers | 38.3 | 90 | 3.13 | 54 | 72 |
| 0 | Electricians | 46 | 89 | 2.98 | 43.5 | 85 |
| 0 | Insulation Workers | 71.7 | 93 | 3.01 | 41.5 | 75 |
| 0 | Construction Laborers | 73.9 | 91 | 3.34 | 49 | 57 |
| 0 | Automotive Technicians and Repairers | 84.7 | 90 | 3.09 | 34 | 80 |
| 0 | Drywall Installers, Ceiling Tile Installers, Tapers | 83.3 | 97 | 3.04 | 49 | 52 |
| 0 | Pipelayers, Plumbers, Pipefitters, and Steamfitters | 83.1 | 81 | 3.3 | 37 | 76 |
| 0 | Heating, Air Conditioning & Refrigeration Mechanics | 99.6 | 73 | 3.51 | 38.5 | 72 |
| 0 | Brickmasons, Blockmasons, and Stonemasons | 51.5 | 97 | 3.13 | 45.5 | 55 |
| 0 | Radio and Telecommunications Equipment Installers | 140.4 | 73 | 3.17 | 32.5 | 70 |
| 0 | Athletes, Coaches, Umpires, and Related Workers | 221 | 77 | 2.59 | 64.5 | 16 |
| 0 | Carpet, Floor, and Tile Installers and Finishers | 53.9 | 78 | 3.13 | 50.5 | 56 |
| 0 | Cement Masons, Concrete Finishers, and Workers | 28.9 | 96 | 3.13 | 48.5 | 46 |
| 0 | Small Engine Mechanics | 38.1 | 97 | 2.88 | 29 | 74 |
| 0 | Maintenance and Repair Workers, General | 105.1 | 78 | 3.1 | 41.5 | 53 |
| 0 | Roofers | 64 | 72 | 3.24 | 51 | 51 |
| 0 | Emergency Medical Technicians and Paramedics | 252.2 | 58 | 4.22 | 24 | 31 |
| 0 | Bailiffs, Correctional Officers, and Jailers | 134.6 | 61 | 3.67 | 49 | 35 |
| 0 | Helpers, Construction Trades | 36.3 | 84 | 2.76 | 46.5 | 61 |
| 0 | Sheet Metal Workers | 66.9 | 96 | 2.76 | 45 | 44 |
| 0 | Woodworking Machine Setters and Operators | 92.6 | 94 | 2.84 | 34 | 50 |
| 0 | Carpenters | 78.2 | 90 | 3.22 | 39 | 39 |
| 0 | Driver/Sales Workers and Truck Drivers | 157.6 | 65 | 2.91 | 31.5 | 60 |
| 0 | Painters and Paperhangers | 56.5 | 86 | 3.01 | 42.5 | 46 |
| 0 | Extruding, Forming, Pressing Machine Operators | 33 | 89 | 2.98 | 44.5 | 46 |
| 0 | Health Practitioner Support Technologists | 49.9 | 82 | 3.07 | 39 | 53 |
| 0 | Supervisors of Firefighting and Prevention Workers | 176.5 | 54 | 2.38 | 44 | 59 |
| 0 | Aircraft Mechanics and Service Technicians | 93.3 | 71 | 2.75 | 31.5 | 70 |
| 0 | Surface Mining Machine Operators and Drillers | 0 | 74 | 2.74 | 41.5 | 75 |
| 0 | Highway Maintenance Workers | 31.9 | 74 | 3.28 | 49 | 44 |
| 0 | Control and Valve Installers and Repairers | 82 | 60 | 3.46 | 29 | 66 |
| 0 | Grounds Maintenance Workers | 57.2 | 83 | 2.86 | 43 | 42 |
| 0 | Machine Tool Cutting Setters, Operators & Tenders | 77.4 | 83 | 2.93 | 44.5 | 33 |
| 0 | Pest Control Workers | 57.7 | 71 | 2.73 | 36.5 | 63 |
| 0 | Packaging and Filling Machine Operators | 65.6 | 89 | 2.9 | 36 | 39 |
| 0 | Animal Caretakers | 27.6 | 83 | 3.03 | 38 | 48 |
| 0 | Printing Workers | 59.5 | 93 | 2.74 | 37.5 | 37 |
| 0 | Cabinetmakers and Bench Carpenters | 39.1 | 91 | 3 | 42.5 | 31 |
| 0 | Welding, Soldering, and Brazing Workers | 67.6 | 82 | 3.19 | 28.5 | 46 |
| 0 | Industrial Machinery Installation and Repair Workers | 41.8 | 74 | 3.18 | 37.5 | 48 |
| 0 | Crushing, Grinding, and Blending Workers | 43.8 | 73 | 3.13 | 41.5 | 42 |
| 0 | Police Officers | 63.7 | 48 | 3.67 | 45 | 42 |
| 0 | Forming Machine Setters, Operators, and Tenders | 46.1 | 86 | 2.94 | 28.5 | 48 |
| 0 | Chemical Processing Machine Setters and Operators | 35.8 | 68 | 3.13 | 29 | 62 |
| 0 | Derrick, Rotary Drill, and Service Unit Operators | 5.6 | 84 | 2.74 | 32.5 | 57 |
| 0 | Baggage Porters, Bellhops, and Concierges | 49.4 | 80 | 3.49 | 45.5 | 15 |
| 0 | Butchers and Meat, Poultry, and Fish Processors | 139.5 | 97 | 2.59 | 34 | 9 |
| 0 | Textile Machine Setters, Operators, and Tenders | 56 | 84 | 2.84 | 39 | 28 |
| 0 | Industrial Truck and Tractor Operators | 53.8 | 67 | 2.88 | 35 | 49 |
| 0 | Building Cleaning Workers | 97.3 | 76 | 2.8 | 39 | 26 |
| 0 | Home Health and Personal Care Aides | 37.8 | 76 | 2.72 | 38 | 42 |
| 0 | Plant and System Operators | 46.4 | 57 | 3.05 | 31 | 59 |
| 0 | Dining Room and Cafeteria Attendants and Helpers | 45.3 | 96 | 2.69 | 47 | 8 |
| 0 | Structural Metal Fabricators and Fitters | 36.3 | 83 | 2.57 | 27 | 50 |
| 0 | Veterinarians | 2.1 | 74 | 3.15 | 29 | 48 |
| 0 | Physical Therapist Assistants and Aides | 64.2 | 71 | 2.98 | 37.5 | 28 |
| 0 | Dishwashers | 28.2 | 98 | 2.54 | 36.5 | 22 |
| 0 | Supervisors of Building and Grounds Cleaning Workers | 87.4 | 68 | 2.73 | 30.5 | 39 |
| 0 | Supervisors of Food Prep and Serving Workers | 23.5 | 90 | 2.4 | 35.5 | 33 |
| 0 | Transportation Service Attendants | 21.8 | 83 | 2.23 | 39 | 39 |
| 0 | Precision Instrument and Equipment Repairers | 25.6 | 64 | 3.17 | 26 | 51 |
| 0 | Postal Service Workers | 0 | 84 | 2.57 | 31.5 | 43 |
| 0 | Supervisors of Production and Operating Workers | 40.3 | 75 | 2.53 | 27 | 46 |
| 0 | Water and Wastewater Treatment Plant Operators | 55 | 59 | 3.05 | 27 | 45 |
| 0 | Licensed Practical and Licensed Vocational Nurses | 60.5 | 69 | 2.91 | 43 | 16 |
| 0 | Laundry and Dry-Cleaning Workers | 113.7 | 91 | 2.51 | 30.5 | 8 |
| 0 | Massage Therapists | 60.6 | 81 | 2.02 | 49 | 17 |
| 0 | Machinists | 58.2 | 88 | 2.71 | 30.5 | 18 |
| 0 | Diagnostic Related Technologists and Technicians | 98.1 | 52 | 2.95 | 26 | 43 |
| 0 | Food Service Managers | 73.5 | 84 | 2.41 | 27.5 | 29 |
| 0 | Food Preparation Workers | 100.6 | 86 | 2.66 | 33.5 | 6 |
| 0 | Waiters and Waitresses | 9.9 | 92 | 2.23 | 43.5 | 18 |
| 0 | Registered Nurses | 81.1 | 50 | 2.76 | 44 | 25 |
| 0 | Bartenders | 9.9 | 89 | 2.36 | 34 | 27 |
| 0 | Multiple Machine Tool Setters, Operators & Tenders | 17.9 | 84 | 3.11 | 28.5 | 19 |
| 0 | Fast Food and Counter Workers | 22.8 | 100 | 2.42 | 25.5 | 22 |
| 0 | Models, Demonstrators, and Product Promoters | 12.1 | 88 | 2.81 | 26.5 | 22 |
| 0 | Painting Workers | 93.2 | 60 | 2.99 | 25 | 27 |
| 0 | Supervisors of Construction and Extraction Workers | 40.2 | 66 | 2.74 | 28.5 | 35 |
| 0 | Bakers | 40.2 | 85 | 3.13 | 24.5 | 13 |
| 0 | Cooks | 20.1 | 84 | 2.72 | 32.5 | 16 |
| 0 | Refuse and Recyclable Material Collectors | 68.4 | 52 | 2.91 | 38 | 22 |
| 0 | Inspectors, Testers, Sorters, and Samplers | 53.9 | 71 | 2.32 | 23 | 41 |
| 0 | Detectives and Criminal Investigators | 0 | 44 | 3.67 | 31.5 | 36 |
| 0 | Agricultural Workers | 31.5 | 66 | 2.8 | 25 | 36 |
| 0 | Surgeons | 0 | 82 | 2.35 | 25 | 32 |
| 0 | Computer, ATM, and Office Machine Repairers | 17.8 | 73 | 1.74 | 20.5 | 55 |
| 0 | Hosts and Hostesses, Restaurant and Coffee Shop | 5.5 | 91 | 2.12 | 28.5 | 21 |
| 0 | Supervisors of Sales Workers | 74.4 | 72 | 2.34 | 25 | 21 |
| 0 | Shipping, Receiving, and Inventory Clerks | 62.6 | 56 | 2.8 | 30.5 | 19 |
| 0 | Mail Clerks and Mail Machine Operators | 73 | 71 | 2.57 | 29 | 8 |
| 0 | Recreation and Fitness Workers | 35.6 | 49 | 2.22 | 43 | 26 |
| 0 | Retail Salespersons | 74.5 | 77 | 2.31 | 25 | 11 |
| 0 | Cashiers | 25.2 | 77 | 2.32 | 27.5 | 19 |
| 0 | Supervisors of Mechanics, Installers, and Repairers | 41.1 | 50 | 2.73 | 25 | 34 |
| 0 | Couriers and Messengers | 58.3 | 36 | 2.76 | 40.5 | 21 |
| 0 | Construction and Building Inspectors | 0 | 59 | 2.22 | 26 | 42 |
| 0 | Construction Equipment Operators | 23.3 | 45 | 2.76 | 27.5 | 35 |
| 0 | CNC Tool Operators and Programmers | 31.8 | 61 | 2.72 | 26.5 | 17 |
| 0 | Preschool and Kindergarten Teachers | 20.1 | 77 | 2.71 | 20 | 13 |
| 0 | Childcare Workers | 12.5 | 67 | 2.42 | 29 | 19 |
| 0 | Supervisors of Transportation and Material Movers | 50.8 | 58 | 2.62 | 27 | 15 |
| 0 | Cargo and Freight Agents | 358 | 30 | 1.41 | 13.5 | 15 |
| 0 | Nurse Practitioners | 6.1 | 53 | 2.3 | 30.5 | 32 |
| 0 | Gambling Services Workers | 33 | 76 | 2.09 | 27.5 | 9 |
| 0 | Pharmacists | 8 | 84 | 2.53 | 19 | 5 |
| 0 | Parking Attendants | 31.7 | 52 | 2.23 | 39 | 9 |
| 0 | Ushers, Lobby Attendants, and Ticket Takers | 20.8 | 78 | 2.23 | 24 | 6 |
| 0 | Barbers, Hairstylists and Cosmetologists | 4.5 | 90 | 2.03 | 24.5 | 2 |
| 0 | Supervisors of Law Enforcement Workers | 0 | 46 | 2.38 | 29 | 29 |
| 0 | Physician Assistants | 7.6 | 58 | 2.27 | 26 | 22 |
| 0 | Occupational Health and Safety Specialists | 23.3 | 49 | 1.96 | 22.5 | 38 |
| 0 | Elementary and Middle School Teachers | 11.4 | 80 | 2.03 | 24.5 | 6 |
| 0 | Supervisors of Personal Service Workers | 9.6 | 51 | 2.39 | 28.5 | 20 |
| 0 | Special Education Teachers | 21.1 | 60 | 2.15 | 23 | 20 |
| 0 | Electrical and Electromechanical Assemblers | 23.4 | 51 | 2.28 | 21.5 | 27 |
| 0 | Chemical Technicians | 23.4 | 67 | 1.79 | 23.5 | 20 |
| 0 | Television, Video, and Film Camera Operators, Editors | 0 | 53 | 1.83 | 25 | 35 |
| 0 | Dental, Ophthalmic Lab Techs, Medical Appliance Techs | 11.7 | 72 | 1.77 | 24.5 | 16 |
| 0 | Industrial Production Managers | 9.7 | 62 | 1.89 | 22.5 | 24 |
| 0 | Designers | 18.2 | 80 | 1.38 | 22 | 16 |
| 0 | Aircraft Pilots and Flight Engineers | 12.2 | 24 | 2.93 | 12.5 | 46 |
| 0 | Counter and Rental Clerks and Parts Salespersons | 17.1 | 55 | 2.32 | 22.5 | 13 |
| 0 | Dentists | 2.8 | 33 | 1.3 | 23 | 59 |
| 0 | Passenger Vehicle Drivers | 68.7 | 38 | 1.57 | 31 | 21 |
| 0 | Photographers | 73.7 | 49 | 1.83 | 15 | 20 |
| 0 | Construction Managers | 19.8 | 41 | 1.98 | 16 | 33 |
| 0 | Surveying and Mapping Technicians | 12.4 | 48 | 1.79 | 24.5 | 21 |
| 0 | Biological Technicians | 16.8 | 45 | 2.41 | 20.5 | 13 |
| 0 | Meeting, Convention, and Event Planners | 12 | 52 | 1.71 | 25 | 13 |
| 0 | Reservation and Transportation Ticket Agents | 58.1 | 57 | 1.39 | 24 | 6 |
| 0 | Tellers | 2.5 | 64 | 1.9 | 13.5 | 14 |
| 0 | Broadcast, Sound, and Lighting Technicians | 6.2 | 36 | 1.83 | 20.5 | 32 |
| 0 | Compliance Officers | 1.6 | 37 | 1.44 | 16 | 45 |
| 0 | Hotel, Motel, and Resort Desk Clerks | 13.1 | 74 | 1.98 | 8.5 | 4 |
| 0 | Residential Advisors | 10.9 | 44 | 2.22 | 21.5 | 10 |
| 0 | Industrial Engineers, Including Health and Safety | 3.4 | 45 | 1.67 | 13.5 | 29 |
| 0 | Library Technicians | 0 | 41 | 2.12 | 20.5 | 11 |
| 0 | Secondary School Teachers | 2.3 | 68 | 2.01 | 3.5 | 6 |
| 0 | Sewing Machine Operators | 55.3 | 21 | 1.75 | 25.5 | 14 |
| 0 | Self-Enrichment Teachers | 28.5 | 38 | 2.08 | 18 | 6 |
| 0 | Teaching Assistants | 30.6 | 48 | 2.18 | 0 | 15 |
| 0 | File Clerks | 35.3 | 27 | 1.71 | 21.5 | 11 |
| 0 | Librarians and Media Collections Specialists | 8.8 | 49 | 1.98 | 2 | 15 |
| 0 | General and Operations Managers | 5.1 | 48 | 1.59 | 14.5 | 5 |
| 0 | Education and Childcare Administrators | 11.9 | 38 | 1.8 | 17.5 | 4 |
| 0 | Social Workers | 11.1 | 38 | 1.31 | 18 | 15 |
| 0 | Sales Representatives, Wholesale and Manufacturing | 7 | 43 | 2.01 | 0 | 17 |
| 0 | Dietitians and Nutritionists | 26.3 | 36 | 2.53 | 0 | 5 |
| 0 | Therapists | 58.8 | 42 | 1.54 | 2 | 10 |
| 0 | Engineering Technicians (Non-Drafters) | 24.8 | 36 | 1.79 | 0 | 20 |
| 0 | Security Guards and Gambling Surveillance Officers | 15.3 | 21 | 1.54 | 17.5 | 19 |
| 0 | Physicians | 1.3 | 48 | 2.35 | 0 | 0 |
| 0 | Transportation, Storage, and Distribution Managers | 32.1 | 38 | 1.88 | 0 | 13 |
| 0 | Opticians, Dispensing | 8.6 | 48 | 1.9 | 0 | 8 |
| 0 | Medical Scientists | 14.2 | 46 | 1.92 | 0 | 8 |
| 0 | Real Estate Brokers and Sales Agents | 10.1 | 44 | 1.46 | 7.5 | 11 |
| 0 | Physical Sciences Teachers, Postsecondary | 0 | 47 | 1.91 | 0 | 9 |
| 0 | Health Teachers, Postsecondary | 0 | 41 | 1.53 | 12.5 | 7 |
| 0 | Computer Support Specialists | 3.3 | 30 | 1.74 | 7.5 | 18 |
| 0 | Administrative Services and Facilities Managers | 29.7 | 37 | 1.26 | 8.5 | 13 |
| 0 | Life Sciences Teachers, Postsecondary | 0 | 49 | 1.79 | 0 | 6 |
| 0 | Customer Service Representatives | 12 | 56 | 1.28 | 3.5 | 2 |
| 0 | Instructional Coordinators | 5.4 | 48 | 1.44 | 7.5 | 2 |
| 0 | Chemists and Materials Scientists | 4.4 | 31 | 2.06 | 0 | 11 |
| 0 | Medical and Health Services Managers | 64.4 | 31 | 1.67 | 0 | 6 |
| 0 | Business Teachers, Postsecondary | 0 | 41 | 2.06 | 0 | 0 |
| 0 | Natural Sciences Managers | 2.2 | 35 | 1.36 | 8.5 | 10 |
| 0 | Interviewers, Except Eligibility and Loan | 5 | 20 | 1.2 | 0 | 38 |
| 0 | Mechanical Engineers | 3.2 | 35 | 1.37 | 0 | 20 |
| 0 | Production, Planning, and Expediting Clerks | 13.3 | 30 | 1.6 | 10 | 3 |
| 0 | Social and Community Service Managers | 19 | 37 | 1.43 | 7.5 | 2 |
| 0 | Training and Development Specialists | 9.1 | 41 | 1.68 | 0 | 3 |
| 0 | Environmental Scientists and Geoscientists | 4.3 | 24 | 2.04 | 3.5 | 7 |
| 0 | Counselors | 6.6 | 28 | 1.53 | 10 | 6 |
| 0 | Buyers and Purchasing Agents | 5.9 | 27 | 1.04 | 19 | 6 |
| 0 | Humanities Teachers, Postsecondary | 0 | 38 | 1.77 | 0 | 4 |
| 0 | Civil Engineers | 0.5 | 30 | 1.53 | 0 | 17 |
| 0 | Order Clerks | 7.7 | 36 | 1.35 | 2 | 11 |
| 0 | Database and Network Administrators and Architects | 1.7 | 50 | 1.22 | 2 | 2 |
| 0 | Court, Municipal, and License Clerks | 0 | 32 | 1.5 | 0 | 15 |
| 0 | Property Appraisers and Assessors | 0 | 31 | 1.46 | 0 | 15 |
| 0 | Actors, Producers, and Directors | 20.1 | 35 | 1.24 | 0 | 11 |
| 0 | Architectural and Engineering Managers | 0 | 29 | 1.39 | 0 | 18 |
| 0 | Property, Real Estate, and Community Managers | 12.2 | 34 | 1.36 | 0 | 10 |
| 0 | Advertising Sales Agents | 4.5 | 35 | 1.54 | 0 | 6 |
| 0 | Architects, Except Naval | 0 | 26 | 1.6 | 0 | 14 |
| 0 | Logisticians and Project Management Specialists | 7.8 | 31 | 1.25 | 0 | 14 |
| 0 | Social Sciences Teachers, Postsecondary | 0 | 35 | 1.59 | 0 | 4 |
| 0 | Supervisors of Office and Administrative Support | 5.1 | 29 | 1.32 | 8.5 | 3 |
| 0 | Writers and Editors | 0 | 25 | 1.08 | 2 | 22 |
| 0 | Receptionists and Information Clerks | 10.5 | 35 | 1.45 | 0 | 2 |
| 0 | Dispatchers | 10 | 32 | 1.12 | 0 | 12 |
| 0 | Secretaries and Administrative Assistants | 3.5 | 35 | 1.39 | 0 | 4 |
| 0 | Math and Computer Science Teachers, Postsecondary | 0 | 29 | 1.69 | 0 | 3 |
| 0 | Electrical and Electronics Engineers | 0.7 | 24 | 1.61 | 2 | 7 |
| 0 | Office Clerks, General | 5.5 | 30 | 1.26 | 0 | 11 |
| 0 | Surveyors, Cartographers, and Photogrammetrists | 6 | 21 | 1.6 | 0 | 11 |
| 0 | Clergy | 5.7 | 33 | 1.44 | 0 | 2 |
| 0 | Biological Scientists | 0 | 18 | 1.92 | 0 | 6 |
| 0 | Chief Executives | 29.8 | 28 | 1.18 | 0 | 5 |
| 0 | Insurance Sales Agents | 0 | 23 | 1.08 | 0 | 19 |
| 0 | Tutors | 0 | 30 | 1.45 | 0 | 2 |
| 0 | Bookkeeping, Accounting, and Auditing Clerks | 2.7 | 27 | 1.11 | 0 | 11 |
| 0 | Computer Hardware Engineers | 5.8 | 27 | 1.25 | 0 | 7 |
| 0 | Artists and Related Workers | 7 | 19 | 1.73 | 0 | 2 |
| 0 | Marketing and Sales Managers | 8.1 | 27 | 1.25 | 0 | 5 |
| 0 | Human Resources Assistants (Non-Payroll) | 7.7 | 27 | 1.16 | 0 | 7 |
| 0 | Public Relations and Fundraising Managers | 3.8 | 33 | 1.05 | 0 | 4 |
| 0 | Securities, Commodities, and Financial Sales Agents | 0 | 24 | 1.55 | 0 | 0 |
| 0 | Lawyers and Judicial Law Clerks | 0 | 27 | 1.35 | 0 | 1 |
| 0 | Drafters | 0 | 24 | 1.03 | 0 | 11 |
| 0 | Computer and Information Analysts | 0.9 | 19 | 1.1 | 0 | 14 |
| 0 | Management Analysts | 0 | 24 | 1.11 | 0 | 9 |
| 0 | Aerospace Engineers | 0 | 24 | 1.05 | 0 | 10 |
| 0 | Human Resources Managers | 13.1 | 26 | 1.17 | 0 | 2 |
| 0 | Market Research Analysts and Marketing Specialists | 4.2 | 22 | 1.24 | 0 | 6 |
| 0 | Education, Library Science Teachers, Postsecondary | 0 | 21 | 1.5 | 0 | 1 |
| 0 | Financial Managers | 4.7 | 25 | 1.13 | 2 | 2 |
| 0 | Purchasing Managers | 19.4 | 21 | 1.16 | 0 | 4 |
| 0 | Telemarketers | 0 | 14 | 1.55 | 0 | 6 |
| 0 | Software and Web Developers, Programmers, Testers | 1.3 | 24 | 1.04 | 0 | 8 |
| 0 | Cost Estimators | 0 | 20 | 1.34 | 0 | 5 |
| 0 | Computer and Information Systems Managers | 1.6 | 14 | 1.17 | 0 | 14 |
| 0 | Payroll and Timekeeping Clerks | 4.5 | 25 | 1.15 | 0 | 3 |
| 0 | Billing and Posting Clerks | 5.6 | 27 | 1.09 | 0 | 2 |
| 0 | Human Resources Workers | 3.5 | 24 | 1.13 | 0 | 4 |
| 0 | Accountants and Auditors | 1.8 | 20 | 1.21 | 0 | 5 |
| 0 | Operations Research Analysts | 6 | 23 | 1.05 | 0 | 5 |
| 0 | Psychologists | 9.9 | 21 | 1.08 | 0 | 5 |
| 0 | Travel Agents | 0 | 17 | 1.55 | 0 | 0 |
| 0 | Loan Interviewers and Clerks | 2.2 | 25 | 1.05 | 0 | 3 |
| 0 | Credit Counselors and Loan Officers | 1.8 | 20 | 1.33 | 0 | 1 |
| 0 | Insurance Claims and Policy Processing Clerks | 11.9 | 14 | 1.14 | 2 | 5 |
| 0 | Compensation, Benefits, and Job Analysis Specialists | 1.5 | 25 | 1.11 | 0 | 0 |
| 0 | Eligibility Interviewers, Government Programs | 0 | 22 | 1.21 | 0 | 0 |
| 0 | Claims Adjusters, Appraisers, and Investigators | 4.7 | 18 | 1.08 | 0 | 5 |
| 0 | Financial Examiners | 0 | 21 | 1.06 | 0 | 3 |
| 0 | Paralegals and Legal Assistants | 0 | 18 | 1.13 | 0 | 1 |
| 0 | Financial Analysts and Advisors | 1.8 | 14 | 1.25 | 0 | 1 |
| 0 | Bill and Account Collectors | 2.5 | 19 | 1.07 | 0 | 0 |
| 0 | Credit Analysts | 0 | 16 | 1.06 | 0 | 3 |
| 0 | Tax Examiners, Collectors, and Revenue Agents | 0 | 15 | 1.13 | 0 | 1 |
| 0 | Data Scientists | 0.9 | 11 | 1.05 | 0 | 5 |
Overview of the Top 5 Most Physically Stressful Jobs
Firefighters
From carrying heavy gear to braving extreme temperatures, the firefighter’s job is built on physical grit. In 2022, nearly one-third of firefighter injuries happened on the fireground, with 36% of these being strains and sprains, 13% cuts or bruises, 7% smoke or gas inhalation, and 7% thermal stress.
Common injuries sustained include the Achilles tendon, rotator cuff, knee, and lower back areas. And firefighters stay busy — in 2020, U.S. fire departments responded to 26.9 million incident runs or calls. With high levels of strength and stamina needed, this profession deserves recovery time to beat the heat.
💪🏼Most common muscular injuries: Rotator cuff, knee, and lower back
Flight Attendants
Flight attendants endure turbulence, heavy luggage, and cramped aisles — all at 35,000 feet in the air. In a single year, they experience a workplace injury nearly six times more than the national average, with common injuries including overexertion and transportation incidents, many of which affect the back, neck, and shoulders.
Paired with the mental stress of the job, the physical strain of cabin operations makes massage sessions after landings essential self-care.
💪🏼Most common muscular injuries: Back, neck, and shoulders


Laborers & Material Movers
Laborers and material movers manually load, lift, and haul throughout every shift. In 2020, this repetitive and physically demanding occupation led to nearly 65,000 injuries that required time away from work. Sprains and strains were the most common injury type, affecting body parts like the back, hands, and shoulders.
As they carry heavy objects or repeatedly bend and squat, this group of hard workers can benefit from massage therapy to support long-term physical resilience on the job.
💪🏼Most common muscular injuries: Back, hands, shoulders, and feet
Line Installers & Repairers
Climbing poles at great heights and operating in confined spaces (under all kinds of weather) takes a physical toll on lineworkers. And the stakes are high — working with live cables on high-voltage lines comes with the risk of electrocution.
Linework injuries include electrical burns, broken bones from falls, and nerve pain from shocks, and the muscles most commonly affected are the back, knee, and wrists. This profession is one of the most dangerous on our ranking, and one that can use R&R between grueling shifts up high.
💪🏼Most common muscular injuries: Back, knee, and wrists


Bus & Truck Mechanics & Diesel Specialists
Mechanics who maintain and repair buses, trucks, and diesel engines undergo regular physical strain: bending, lifting, and working in tight spaces. These specialists handle greasy equipment and are commonly subjected to cuts and sprains.
Diesel mechanics deal with daily exposure to loud sound levels and have an O*NET score of 84 (meaning “everyday”) for working in cramped or awkward positions.
With continual wear-and-tear on the body, this profession can get targeted relief on commonly injured areas like the back, hips, and wrists through massage therapy.
💪🏼Most common muscular injuries: Back, neck, joints, and wrist
Top High-Stress Jobs Ranked by Mental Pressure
See BBI’s ranking for the most mentally stressful jobs in the U.S., sorted from most stressful at number 1 to least stressful at number 250.
This table defaults to equal weighting for each stress factor to present a bias-free starting point. Adjust the sliders based on your unique experience — what factors are most valuable to your perception of mental stress?
Each stress factor was carefully selected to reflect common, measurable indicators across all professions in the dataset.
Desktop: Adjust each metric slider to change how much it weighs in the overall ranking.
Mobile: Click “show controls” to display sliders and adjust each metric.
| Overall Rank | Job Title | Annual Separation % | Job Conflict Score | Time Pressure Score | Error Impact Score | Competitiveness Score |
|---|---|---|---|---|---|---|
| 0 | Flight Attendants | 13.3 | 90 | 87 | 87 | 42 |
| 0 | Small Engine Mechanics | 10.1 | 65 | 89 | 90 | 67 |
| 0 | Physician Assistants | 4.9 | 72 | 84 | 87 | 81 |
| 0 | Aircraft Pilots and Flight Engineers | 11.3 | 54 | 89 | 84 | 76 |
| 0 | Bailiffs, Correctional Officers, and Jailers | 8.9 | 94 | 86 | 70 | 56 |
| 0 | Pharmacists | 3.6 | 68 | 92 | 96 | 67 |
| 0 | Derrick, Rotary Drill, and Service Unit Operators | 9.8 | 54 | 78 | 87 | 84 |
| 0 | Gambling Services Workers | 16.7 | 77 | 77 | 75 | 49 |
| 0 | Supervisors of Food Prep and Serving Workers | 14.3 | 85 | 79 | 56 | 59 |
| 0 | Real Estate Brokers and Sales Agents | 8.2 | 55 | 88 | 60 | 96 |
| 0 | Bill and Account Collectors | 10.1 | 91 | 73 | 53 | 63 |
| 0 | Detectives and Criminal Investigators | 7.2 | 78 | 70 | 83 | 60 |
| 0 | Transportation Service Attendants | 15.1 | 91 | 60 | 71 | 37 |
| 0 | Butchers and Meat, Poultry, and Fish Processors | 11.9 | 71 | 78 | 73 | 47 |
| 0 | Police Officers | 7.4 | 91 | 74 | 66 | 48 |
| 0 | Industrial Truck and Tractor Operators | 9.7 | 39 | 87 | 82 | 65 |
| 0 | Nursing Assistants and Psychiatric Aides | 14 | 76 | 68 | 60 | 50 |
| 0 | Supervisors of Personal Service Workers | 10.3 | 69 | 85 | 67 | 45 |
| 0 | Packaging and Filling Machine Operators | 10.9 | 57 | 86 | 60 | 61 |
| 0 | Emergency Medical Technicians and Paramedics | 6.3 | 64 | 96 | 75 | 44 |
| 0 | Supervisors of Building and Grounds Cleaning Workers | 10.3 | 57 | 82 | 63 | 61 |
| 0 | Loan Interviewers and Clerks | 8.2 | 68 | 88 | 36 | 75 |
| 0 | Nurse Practitioners | 4.3 | 63 | 77 | 85 | 58 |
| 0 | Supervisors of Law Enforcement Workers | 6.9 | 84 | 63 | 71 | 55 |
| 0 | Firefighters | 7.3 | 63 | 65 | 80 | 65 |
| 0 | Driver/Sales Workers and Truck Drivers | 10.2 | 59 | 98 | 53 | 50 |
| 0 | Line Installers and Repairers | 8.3 | 54 | 78 | 77 | 59 |
| 0 | Physicians | 2.4 | 66 | 93 | 99 | 29 |
| 0 | Radio and Telecommunications Equipment Installers | 9.4 | 55 | 89 | 59 | 59 |
| 0 | Customer Service Representatives | 13.2 | 80 | 89 | 29 | 48 |
| 0 | Cement Masons, Concrete Finishers, and Workers | 7.3 | 61 | 69 | 62 | 77 |
| 0 | Surface Mining Machine Operators and Drillers | 10.3 | 53 | 60 | 82 | 66 |
| 0 | Registered Nurses | 5.1 | 79 | 75 | 74 | 47 |
| 0 | Dispatchers | 9.6 | 86 | 87 | 33 | 50 |
| 0 | Construction Equipment Operators | 8.3 | 46 | 76 | 97 | 48 |
| 0 | Supervisors of Production and Operating Workers | 9.3 | 66 | 88 | 53 | 52 |
| 0 | Carpenters | 7.7 | 51 | 86 | 70 | 59 |
| 0 | Reservation and Transportation Ticket Agents | 10.4 | 76 | 87 | 61 | 31 |
| 0 | Construction Managers | 7.5 | 58 | 75 | 64 | 69 |
| 0 | Licensed Practical and Licensed Vocational Nurses | 7.9 | 75 | 85 | 61 | 42 |
| 0 | Telemarketers | 12.9 | 79 | 69 | 22 | 74 |
| 0 | Insurance Sales Agents | 7.7 | 54 | 88 | 50 | 71 |
| 0 | Chemical Technicians | 11.7 | 43 | 84 | 71 | 54 |
| 0 | Advertising Sales Agents | 10.2 | 54 | 87 | 25 | 87 |
| 0 | Dentists | 2.5 | 61 | 70 | 80 | 71 |
| 0 | Food Service Managers | 11.1 | 78 | 74 | 37 | 61 |
| 0 | Athletes, Coaches, Umpires, and Related Workers | 12.8 | 50 | 72 | 38 | 86 |
| 0 | Automotive Technicians and Repairers | 8.1 | 55 | 87 | 64 | 56 |
| 0 | Mail Clerks and Mail Machine Operators | 11.8 | 60 | 78 | 62 | 49 |
| 0 | Veterinarians | 2.7 | 65 | 80 | 77 | 57 |
| 0 | Supervisors of Firefighting and Prevention Workers | 6.1 | 57 | 63 | 86 | 63 |
| 0 | Structural Iron and Steel Workers | 8.2 | 50 | 81 | 64 | 65 |
| 0 | Public Relations and Fundraising Managers | 7.9 | 52 | 89 | 47 | 71 |
| 0 | Surgeons | 2 | 61 | 65 | 78 | 76 |
| 0 | Highway Maintenance Workers | 8.1 | 60 | 68 | 79 | 53 |
| 0 | Actors, Producers, and Directors | 8.3 | 57 | 84 | 41 | 74 |
| 0 | Laborers and Material Movers | 14.3 | 53 | 69 | 67 | 50 |
| 0 | Claims Adjusters, Appraisers, and Investigators | 6.7 | 78 | 85 | 43 | 54 |
| 0 | Supervisors of Transportation and Material Movers | 9.8 | 51 | 88 | 44 | 68 |
| 0 | Supervisors of Construction and Extraction Workers | 7.6 | 57 | 78 | 57 | 67 |
| 0 | Retail Salespersons | 14.5 | 72 | 61 | 34 | 68 |
| 0 | Fast Food and Counter Workers | 23.2 | 60 | 65 | 37 | 45 |
| 0 | Forming Machine Setters, Operators, and Tenders | 10.2 | 51 | 87 | 63 | 49 |
| 0 | Residential Advisors | 18.5 | 61 | 67 | 62 | 33 |
| 0 | Couriers and Messengers | 10.2 | 61 | 93 | 43 | 50 |
| 0 | Tellers | 10 | 73 | 63 | 55 | 58 |
| 0 | Construction and Building Inspectors | 10.5 | 64 | 77 | 58 | 48 |
| 0 | Interviewers, Except Eligibility and Loan | 11.8 | 74 | 80 | 34 | 52 |
| 0 | Transportation, Storage, and Distribution Managers | 8 | 59 | 85 | 51 | 59 |
| 0 | Chemical Processing Machine Setters and Operators | 9.9 | 47 | 76 | 75 | 52 |
| 0 | Sheet Metal Workers | 8.9 | 47 | 75 | 72 | 59 |
| 0 | Diagnostic Related Technologists and Technicians | 5.1 | 68 | 83 | 69 | 43 |
| 0 | Cargo and Freight Agents | 9 | 67 | 74 | 51 | 57 |
| 0 | Roofers | 7.3 | 48 | 80 | 53 | 74 |
| 0 | Recreation and Fitness Workers | 19.2 | 64 | 58 | 60 | 35 |
| 0 | Electricians | 8.7 | 57 | 83 | 58 | 52 |
| 0 | Writers and Editors | 8.7 | 45 | 93 | 21 | 87 |
| 0 | Helpers, Construction Trades | 10.7 | 31 | 86 | 61 | 65 |
| 0 | Physical Therapist Assistants and Aides | 14.7 | 59 | 63 | 71 | 37 |
| 0 | Cooks | 15 | 67 | 57 | 73 | 32 |
| 0 | Travel Agents | 11.4 | 40 | 68 | 60 | 72 |
| 0 | Models, Demonstrators, and Product Promoters | 17.9 | 61 | 71 | 30 | 53 |
| 0 | Buyers and Purchasing Agents | 9.4 | 43 | 70 | 67 | 66 |
| 0 | Property, Real Estate, and Community Managers | 7.7 | 68 | 74 | 40 | 66 |
| 0 | Pest Control Workers | 12.3 | 47 | 79 | 57 | 51 |
| 0 | Home Health and Personal Care Aides | 14.6 | 44 | 77 | 69 | 37 |
| 0 | Health Practitioner Support Technologists | 8.9 | 59 | 74 | 71 | 41 |
| 0 | Sales Representatives, Wholesale and Manufacturing | 8.7 | 63 | 73 | 38 | 69 |
| 0 | Meeting, Convention, and Event Planners | 10.1 | 53 | 89 | 22 | 73 |
| 0 | Chief Executives | 6.6 | 56 | 79 | 51 | 64 |
| 0 | Plant and System Operators | 9.3 | 44 | 78 | 78 | 43 |
| 0 | Aircraft Mechanics and Service Technicians | 7.4 | 36 | 80 | 86 | 48 |
| 0 | Brickmasons, Blockmasons, and Stonemasons | 7.3 | 59 | 77 | 52 | 59 |
| 0 | Compliance Officers | 7.8 | 76 | 63 | 63 | 43 |
| 0 | Securities, Commodities, and Financial Sales Agents | 7.1 | 45 | 72 | 58 | 73 |
| 0 | Opticians, Dispensing | 9.1 | 68 | 76 | 30 | 64 |
| 0 | Welding, Soldering, and Brazing Workers | 9.8 | 24 | 82 | 72 | 61 |
| 0 | Education and Childcare Administrators | 6.6 | 56 | 73 | 71 | 48 |
| 0 | Marketing and Sales Managers | 7.8 | 44 | 80 | 44 | 74 |
| 0 | Agricultural Workers | 15.3 | 54 | 73 | 53 | 38 |
| 0 | Human Resources Managers | 7.5 | 57 | 70 | 61 | 55 |
| 0 | Occupational Health and Safety Specialists | 9.7 | 43 | 69 | 74 | 49 |
| 0 | Hotel, Motel, and Resort Desk Clerks | 15.7 | 82 | 55 | 33 | 41 |
| 0 | Social Workers | 7.9 | 72 | 75 | 43 | 46 |
| 0 | Electrical and Electromechanical Assemblers | 10.5 | 38 | 87 | 51 | 53 |
| 0 | Human Resources Assistants (Non-Payroll) | 10.9 | 63 | 82 | 32 | 48 |
| 0 | Bus and Truck Mechanics and Diesel Specialists | 8.1 | 48 | 77 | 61 | 50 |
| 0 | Architects, Except Naval | 6 | 44 | 66 | 55 | 78 |
| 0 | Computer and Information Systems Managers | 6.6 | 49 | 59 | 68 | 66 |
| 0 | Financial Managers | 6.8 | 41 | 89 | 50 | 59 |
| 0 | Logisticians and Project Management Specialists | 7.2 | 50 | 86 | 40 | 60 |
| 0 | Production, Planning, and Expediting Clerks | 9.7 | 48 | 89 | 55 | 36 |
| 0 | Water and Wastewater Treatment Plant Operators | 9.1 | 35 | 70 | 79 | 49 |
| 0 | Animal Caretakers | 17.7 | 56 | 58 | 58 | 30 |
| 0 | Supervisors of Office and Administrative Support | 9.4 | 54 | 76 | 48 | 49 |
| 0 | Construction Laborers | 8.3 | 49 | 78 | 70 | 35 |
| 0 | General and Operations Managers | 8 | 56 | 77 | 38 | 59 |
| 0 | Control and Valve Installers and Repairers | 8 | 58 | 76 | 70 | 28 |
| 0 | Dental, Ophthalmic Lab Techs, Medical Appliance Techs | 11 | 62 | 90 | 25 | 41 |
| 0 | Shipping, Receiving, and Inventory Clerks | 9.6 | 47 | 89 | 37 | 51 |
| 0 | Television, Video, and Film Camera Operators, Editors | 7.8 | 48 | 73 | 61 | 50 |
| 0 | Industrial Production Managers | 7 | 50 | 80 | 51 | 51 |
| 0 | Bakers | 15.7 | 31 | 83 | 45 | 45 |
| 0 | Management Analysts | 7.9 | 45 | 75 | 45 | 64 |
| 0 | Parking Attendants | 14.5 | 63 | 50 | 62 | 34 |
| 0 | Waiters and Waitresses | 20.5 | 68 | 47 | 21 | 50 |
| 0 | Cabinetmakers and Bench Carpenters | 9.4 | 56 | 78 | 38 | 50 |
| 0 | Medical and Health Services Managers | 7.1 | 60 | 73 | 35 | 61 |
| 0 | Human Resources Workers | 8.1 | 60 | 69 | 48 | 49 |
| 0 | Medical Scientists | 4.7 | 35 | 67 | 61 | 75 |
| 0 | Extruding, Forming, Pressing Machine Operators | 9.7 | 51 | 73 | 55 | 41 |
| 0 | Heating, Air Conditioning & Refrigeration Mechanics | 8.3 | 38 | 70 | 66 | 52 |
| 0 | Refuse and Recyclable Material Collectors | 11.8 | 48 | 69 | 54 | 41 |
| 0 | Court, Municipal, and License Clerks | 9.8 | 72 | 77 | 41 | 26 |
| 0 | Textile Machine Setters, Operators, and Tenders | 12.2 | 54 | 72 | 57 | 27 |
| 0 | Structural Metal Fabricators and Fitters | 10.5 | 39 | 83 | 49 | 44 |
| 0 | Photographers | 8.5 | 35 | 73 | 32 | 81 |
| 0 | Therapists | 4.7 | 69 | 90 | 36 | 36 |
| 0 | Cashiers | 19 | 78 | 52 | 23 | 32 |
| 0 | Designers | 8.8 | 60 | 78 | 31 | 49 |
| 0 | Grounds Maintenance Workers | 12.8 | 58 | 57 | 48 | 44 |
| 0 | Hosts and Hostesses, Restaurant and Coffee Shop | 25.3 | 75 | 33 | 24 | 33 |
| 0 | Pipelayers, Plumbers, Pipefitters, and Steamfitters | 8.3 | 50 | 71 | 59 | 42 |
| 0 | Computer, ATM, and Office Machine Repairers | 9.9 | 48 | 81 | 39 | 47 |
| 0 | Secondary School Teachers | 6.1 | 65 | 69 | 41 | 52 |
| 0 | Machine Tool Cutting Setters, Operators & Tenders | 10.1 | 29 | 84 | 56 | 47 |
| 0 | Industrial Engineers, Including Health and Safety | 5.9 | 43 | 73 | 57 | 56 |
| 0 | Security Guards and Gambling Surveillance Officers | 12.7 | 49 | 54 | 66 | 39 |
| 0 | Maintenance and Repair Workers, General | 9 | 58 | 68 | 55 | 37 |
| 0 | Social and Community Service Managers | 7.8 | 69 | 73 | 48 | 30 |
| 0 | Supervisors of Sales Workers | 9.8 | 65 | 81 | 17 | 47 |
| 0 | Accountants and Auditors | 7.6 | 36 | 80 | 44 | 60 |
| 0 | Childcare Workers | 17 | 48 | 62 | 42 | 37 |
| 0 | Life Sciences Teachers, Postsecondary | 7.4 | 39 | 76 | 34 | 70 |
| 0 | Civil Engineers | 5.9 | 32 | 75 | 61 | 58 |
| 0 | Psychologists | 5.4 | 46 | 73 | 35 | 71 |
| 0 | Precision Instrument and Equipment Repairers | 8.3 | 34 | 71 | 63 | 50 |
| 0 | Purchasing Managers | 7.3 | 49 | 79 | 29 | 60 |
| 0 | Laundry and Dry-Cleaning Workers | 13.8 | 39 | 73 | 23 | 61 |
| 0 | Health Teachers, Postsecondary | 7.4 | 49 | 70 | 47 | 52 |
| 0 | CNC Tool Operators and Programmers | 9.4 | 43 | 70 | 56 | 43 |
| 0 | Insulation Workers | 8.3 | 46 | 82 | 29 | 56 |
| 0 | File Clerks | 11.9 | 56 | 65 | 37 | 44 |
| 0 | Dining Room and Cafeteria Attendants and Helpers | 18.5 | 64 | 47 | 22 | 46 |
| 0 | Credit Counselors and Loan Officers | 6.7 | 63 | 71 | 36 | 47 |
| 0 | Barbers, Hairstylists and Cosmetologists | 12.6 | 43 | 60 | 32 | 64 |
| 0 | Machinists | 9.9 | 23 | 81 | 51 | 54 |
| 0 | Tax Examiners, Collectors, and Revenue Agents | 9.9 | 65 | 69 | 48 | 25 |
| 0 | Computer Support Specialists | 6.3 | 48 | 66 | 62 | 44 |
| 0 | Ushers, Lobby Attendants, and Ticket Takers | 27.5 | 73 | 37 | 18 | 20 |
| 0 | Woodworking Machine Setters and Operators | 10.7 | 44 | 74 | 45 | 41 |
| 0 | Crushing, Grinding, and Blending Workers | 9.8 | 19 | 68 | 74 | 49 |
| 0 | Lawyers and Judicial Law Clerks | 3.6 | 48 | 77 | 43 | 58 |
| 0 | Electrical and Electronics Engineers | 5.4 | 42 | 80 | 50 | 48 |
| 0 | Dietitians and Nutritionists | 6.5 | 53 | 71 | 34 | 56 |
| 0 | Environmental Scientists and Geoscientists | 8.6 | 39 | 70 | 39 | 60 |
| 0 | Multiple Machine Tool Setters, Operators & Tenders | 9.8 | 22 | 87 | 55 | 41 |
| 0 | Broadcast, Sound, and Lighting Technicians | 8.4 | 39 | 73 | 54 | 43 |
| 0 | Counter and Rental Clerks and Parts Salespersons | 10.8 | 76 | 57 | 23 | 42 |
| 0 | Market Research Analysts and Marketing Specialists | 8.6 | 37 | 76 | 36 | 58 |
| 0 | Drywall Installers, Ceiling Tile Installers, Tapers | 6.8 | 43 | 68 | 45 | 57 |
| 0 | Printing Workers | 11.7 | 31 | 72 | 52 | 42 |
| 0 | Natural Sciences Managers | 7.3 | 33 | 57 | 53 | 69 |
| 0 | Carpet, Floor, and Tile Installers and Finishers | 7.1 | 34 | 74 | 47 | 56 |
| 0 | Eligibility Interviewers, Government Programs | 8.4 | 49 | 82 | 42 | 32 |
| 0 | Surveying and Mapping Technicians | 12.3 | 32 | 68 | 44 | 50 |
| 0 | Software and Web Developers, Programmers, Testers | 5.3 | 35 | 72 | 45 | 64 |
| 0 | Elementary and Middle School Teachers | 6.6 | 76 | 69 | 22 | 41 |
| 0 | Passenger Vehicle Drivers | 12.9 | 76 | 48 | 35 | 30 |
| 0 | Bookkeeping, Accounting, and Auditing Clerks | 11.3 | 42 | 72 | 36 | 44 |
| 0 | Food Preparation Workers | 17.9 | 24 | 73 | 53 | 24 |
| 0 | Compensation, Benefits, and Job Analysis Specialists | 7 | 45 | 72 | 47 | 44 |
| 0 | Paralegals and Legal Assistants | 10 | 24 | 84 | 48 | 42 |
| 0 | Teaching Assistants | 11.7 | 30 | 62 | 35 | 65 |
| 0 | Postal Service Workers | 7.7 | 74 | 67 | 32 | 29 |
| 0 | Architectural and Engineering Managers | 6.4 | 40 | 70 | 38 | 60 |
| 0 | Secretaries and Administrative Assistants | 12.6 | 52 | 75 | 36 | 23 |
| 0 | Library Technicians | 17.2 | 47 | 62 | 26 | 36 |
| 0 | Insurance Claims and Policy Processing Clerks | 8.8 | 51 | 74 | 33 | 40 |
| 0 | Administrative Services and Facilities Managers | 8 | 52 | 68 | 44 | 37 |
| 0 | Supervisors of Mechanics, Installers, and Repairers | 7.9 | 43 | 73 | 37 | 48 |
| 0 | Inspectors, Testers, Sorters, and Samplers | 11.4 | 46 | 68 | 37 | 38 |
| 0 | Financial Analysts and Advisors | 6.4 | 25 | 67 | 52 | 63 |
| 0 | Payroll and Timekeeping Clerks | 10.3 | 43 | 81 | 31 | 36 |
| 0 | Humanities Teachers, Postsecondary | 7.4 | 33 | 69 | 38 | 61 |
| 0 | Preschool and Kindergarten Teachers | 10.9 | 47 | 69 | 29 | 43 |
| 0 | Painters and Paperhangers | 7.7 | 32 | 76 | 39 | 52 |
| 0 | Baggage Porters, Bellhops, and Concierges | 15.1 | 66 | 35 | 50 | 25 |
| 0 | Office Clerks, General | 11.6 | 52 | 69 | 36 | 27 |
| 0 | Clergy | 8.6 | 47 | 72 | 44 | 31 |
| 0 | Counselors | 8 | 61 | 75 | 28 | 30 |
| 0 | Social Sciences Teachers, Postsecondary | 7.4 | 49 | 64 | 13 | 70 |
| 0 | Order Clerks | 11.5 | 49 | 79 | 15 | 39 |
| 0 | Mechanical Engineers | 5.4 | 26 | 63 | 50 | 67 |
| 0 | Credit Analysts | 6.8 | 25 | 80 | 40 | 54 |
| 0 | Chemists and Materials Scientists | 7.1 | 26 | 60 | 51 | 62 |
| 0 | Physical Sciences Teachers, Postsecondary | 7.4 | 42 | 67 | 33 | 53 |
| 0 | Computer Hardware Engineers | 5 | 23 | 67 | 41 | 73 |
| 0 | Data Scientists | 5.6 | 37 | 74 | 29 | 59 |
| 0 | Industrial Machinery Installation and Repair Workers | 7.9 | 42 | 67 | 36 | 46 |
| 0 | Math and Computer Science Teachers, Postsecondary | 7.4 | 38 | 76 | 16 | 61 |
| 0 | Drafters | 8.3 | 30 | 69 | 42 | 48 |
| 0 | Cost Estimators | 8.4 | 29 | 69 | 34 | 56 |
| 0 | Biological Scientists | 7.4 | 25 | 61 | 28 | 77 |
| 0 | Tutors | 17.3 | 44 | 63 | 10 | 38 |
| 0 | Instructional Coordinators | 8.7 | 49 | 66 | 18 | 49 |
| 0 | Computer and Information Analysts | 5.6 | 28 | 68 | 40 | 58 |
| 0 | Sewing Machine Operators | 11.3 | 42 | 69 | 22 | 40 |
| 0 | Database and Network Administrators and Architects | 5.3 | 31 | 50 | 72 | 44 |
| 0 | Librarians and Media Collections Specialists | 8.9 | 53 | 63 | 26 | 38 |
| 0 | Property Appraisers and Assessors | 7.7 | 44 | 63 | 30 | 47 |
| 0 | Financial Examiners | 7.1 | 34 | 65 | 34 | 52 |
| 0 | Education, Library Science Teachers, Postsecondary | 7.4 | 43 | 65 | 23 | 51 |
| 0 | Engineering Technicians (Non-Drafters) | 8.6 | 43 | 60 | 36 | 40 |
| 0 | Training and Development Specialists | 8.4 | 41 | 68 | 26 | 43 |
| 0 | Aerospace Engineers | 5.4 | 35 | 64 | 44 | 46 |
| 0 | Business Teachers, Postsecondary | 7.4 | 42 | 67 | 21 | 50 |
| 0 | Billing and Posting Clerks | 10 | 49 | 73 | 23 | 26 |
| 0 | Surveyors, Cartographers, and Photogrammetrists | 6.7 | 28 | 74 | 38 | 43 |
| 0 | Biological Technicians | 11.3 | 15 | 58 | 43 | 53 |
| 0 | Operations Research Analysts | 6.2 | 20 | 64 | 34 | 66 |
| 0 | Artists and Related Workers | 8.5 | 23 | 55 | 14 | 83 |
| 0 | Dishwashers | 16.7 | 39 | 63 | 11 | 33 |
| 0 | Massage Therapists | 12.6 | 30 | 32 | 41 | 57 |
| 0 | Building Cleaning Workers | 14 | 43 | 49 | 35 | 21 |
| 0 | Bartenders | 16.7 | 73 | 19 | 11 | 34 |
| 0 | Receptionists and Information Clerks | 13.2 | 61 | 43 | 24 | 13 |
| 0 | Special Education Teachers | 6.8 | 43 | 52 | 35 | 28 |
| 0 | Painting Workers | 9.2 | 28 | 47 | 21 | 37 |
| 0 | Self-Enrichment Teachers | 11.9 | 29 | 44 | 21 | 27 |
Overview of the Top 5 Most Mentally Stressful Jobs
Flight Attendants
Passenger safety, variable schedules, and disruptive behavior on board — flight attendants deal with many mental stressors while working. In 2021, a record high of 5,973 unruly passengers were reported, marking a 492% increase from the previous year. This highlights the intense conflict management flight crews navigate.
A 2023 review of multiple studies found that 40% of cabin crews are at risk of depression, with 1 in 4 reporting high levels of work stress. With common stressors like conflict exposure and fatigue, it’s no surprise that flight attendants rank #1 and can use some R&R between flights.
🧠Most Common Mental Stressors: Conflict exposure, fatigue, and poor sleep
Small Engine Mechanics
Small engine mechanics repair power equipment engines such as lawnmowers, snowmobiles, and motorcycles. This work requires sharp focus and precision, often in noisy, high-distraction environments. According to O*NET data, this profession’s most common mental stressors are annual job separations, time pressure, and mistake impact.
As of May 2024, the median annual wage for small engine mechanics is $48,240, which reflects a skilled but often under-recognized trade. With daily accuracy demands and unpredictable problem-solving, small engine mechanics are well-suited to benefit from regular stress relief.
🧠Most Common Mental Stressors: Job separations and pressure to fix issues quickly


Physician Assistants
Physician assistants (PAs) treat patients under physician supervision, working with great care in fast-paced clinical environments. Common mental stressors include mistake impact, time pressure, and industry competition factors.
Studies have shown that 55% of PAs say they spend too much time at work, with some specialties showing levels of burnout higher than 60%. And when compared to the general population, PA students are experiencing levels of anxiety that are 65.3% higher.
Physician assistants often face intense patient interactions and clinical responsibility without full autonomy, making them a prime candidate for relaxing bodywork.
🧠Most Common Mental Stressors: Emotional strain from patient care responsibility and burnout
Aircraft Pilots & Flight Engineers
Pilots and flight engineers are responsible for passenger safety and work under intense scrutiny. The most common mental stressors include decision-making under pressure, constant concentration while flying, and fatigue from long flights.
A 2024 report, commissioned by the Federal Aviation Administration (FAA), recognized the widespread belief in aviation that pilots who seek mental health help are disadvantaged for following disclosure rules. In recent years, the FAA has also invested in resources to help reduce the stigma of mental health in the aviation community and encourage pilots to seek support.
For pilots dealing with work-related mental stress, massage therapy can promote relaxation and improve sleep quality for better performance.
🧠Most Common Mental Stressors: Decision-making under pressure and fatigue


Bailiffs, Correctional Officers, & Jailers
Bailiffs, correctional officers, and jailers face high-stakes work environments and must maintain constant vigilance, which can take a mental toll on their well-being.
Research in 2019 found that 53.4% of correctional officers report having post-traumatic stress disorder (PTSD). Another study, revisited in 2023, showed that 1 out of 4 correctional officers in Massachusetts had symptoms of anger and anxiety.
With common mental stressors like conflict exposure (the top ranking on our list!), this group of professions could benefit from massage-centered stress relief from their work.
🧠Most Common Mental Stressors: Constant alertness and exposure to conflict
✨Flight attendants are the only profession to appear on both our top 5 most mentally and physically stressful jobs — making them the #1 profession in need of massage therapy. Between managing in-flight emergencies and unruly passengers, and enduring long hours on their feet in cramped cabins, flight crews face nonstop demands on both body and mind. Massage offers a vital reset between flights.
Insights From Real Massage Therapists
What Advice Would You Give to Someone in a High-Stress Job Who’s Never Had a Massage but Is Considering It?
How can regular massage therapy play a preventive role in managing work-related stress, rather than just treating it after it builds up?
Outside of these effects on the body, what happens to the brain is far more complicated. The effects of stress can accumulate quickly, and once you add in unproductive or interrupted sleep, stress management becomes exponentially more difficult.
When clients come in for stress-related issues, what are some early indicators you look for to understand how their job might be affecting their body?
Considerations for Massage Professionals
Whether you’re focused on ergonomics in the workplace or maintaining a healthy work-life balance, consider these tips as you support clients dealing with job-related stress.
Refer Out When Needed
It’s essential to recognize the boundaries of your scope of practice. If a client is suffering from chronic pain that isn’t improving or experiencing emotional distress beyond what your practice can support, be responsible and refer them to the appropriate healthcare provider.
Learn more about risk management for massage therapists.
Care for Yourself, Too
From long hours on your feet to emotionally intense sessions, massage therapy comes with major stressors, so don’t forget that caring for others starts with caring for yourself. Prioritize proper body mechanics and schedule time off to rest so you can be your best work self, both physically and mentally.
Carry Liability Insurance
Accidents happen even to the most careful massage therapists. And if you ever face a claim, carrying massage therapy insurance protects you from financial risks like client injuries, allergic reactions, or perceived mistakes.
The right coverage gives you peace of mind to help clients — and relieves the stress of expensive what-ifs from your everyday work. BBI offers top-rated insurance starting at 26 cents a day.
Learn more about massage insurance costs.
Methodology
We sourced data for this report in June 2025 from the U.S. Department of Labor O*NET and the U.S. Bureau of Labor Statistics. We evaluated over 250 professions with at least 50,000 workers employed nationally, with a focus on “broad” and “minor” classifications, removing any duplicate or “miscellaneous”-titled occupations.
In cases where job categories didn’t perfectly align between BLS and O*NET, we used the official crosswalk tools from O*NET and the BLS to match the closest equivalent roles.
Physical Stress Composite Score
This score reflects the physical demands of each job, using five equally weighted indicators for the default ranking:
- Exertion Injuries per 10k
- Standing Score
- Strength Score
- Stamina Score
- Cramped Work Score
“Exertion injuries” are measured as the number of DART (days away, restricted, or transferred) injuries per 10,000 full-time workers each year, by occupation. This data was sourced from the BLS Survey of Occupational Injuries and Illnesses and reflects a two-year average from 2021 and 2022.
“Strength Score” represents the average strength needs of each job, based on the BLS 2023 Occupational Requirements Survey. Jobs are rated on a scale from 1 to 5, corresponding to sedentary (1), light (2), medium (3), heavy (4), and very heavy (5) work.
The remaining three variables were normalized and equally weighted to create a standardized physical strain score, using the most recent Department of Labor data (updated in December 2024). This approach provides a fair comparison across occupations while allowing users to adjust the rankings based on their own priorities.
All variables were then converted to a common 1-100 scale (e.g., a score of 25 indicates a low number of overexertion injuries, while 75 indicates a high number), making it easier to interpret and compare data.
Mental Stress Composite Score
This score evaluates mental and emotional demands across five equally weighted variables for the default ranking:
- Annual Separation %
- Job Conflict Score
- Time Pressure Score
- Error Impact Score
- Competitiveness Score
“Annual separation %” represents a percentage of an occupation’s total employees from BLS data, last updated August 2024.
All other variables were sourced from the latest Department of Labor BLS and O*NET data (updated December 2024) and standardized on a common 1-100 scale (e.g., a score of 25 = low competition, 75 = high competition) to allow easy comparison.
Separation is defined as quits, layoffs, discharges, and other instances of separation between an employee and their job.
Acknowledgements
Special thanks to the licensed massage professionals who offered their expert insights: David Weintraub, Kathleen Lisson and Casey Navis
Additional Sources
- “Job Burnout At 66% In 2025, New Study Shows,” Forbes, February 8, 2025.
- “Job Insecurity Causing Stress,” American Psychological Association, May 2025.